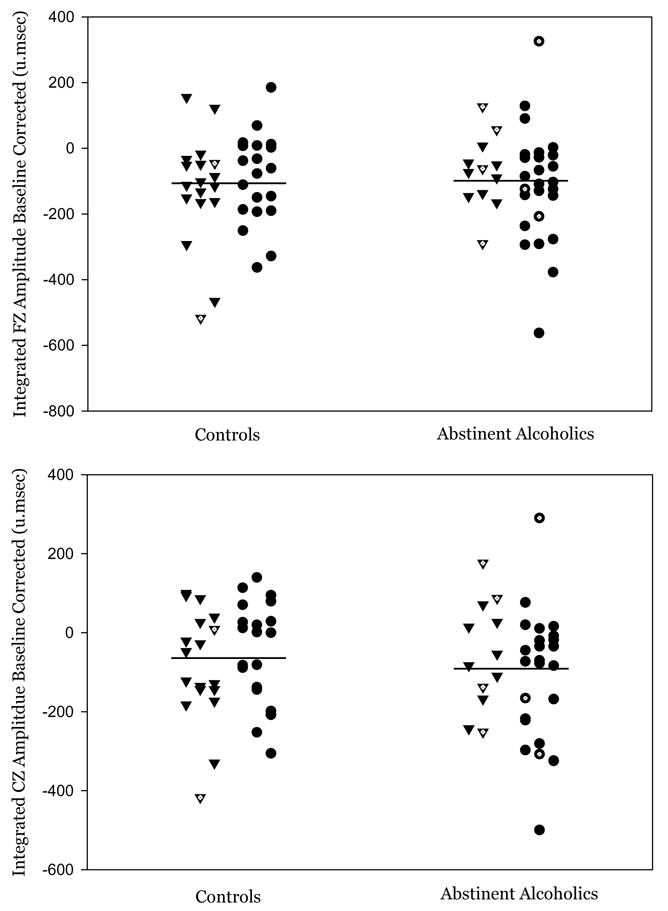
Figure 2.

A scatter plot of the MMN integrals for the baseline corrected data is presented. Within each group, family history positive subjects are represented by triangles and family history negative subjects are represented by circles. Subjects whose MMN integral was computed from less than 40 artifact-free trials are indicated by hollow symbols.
