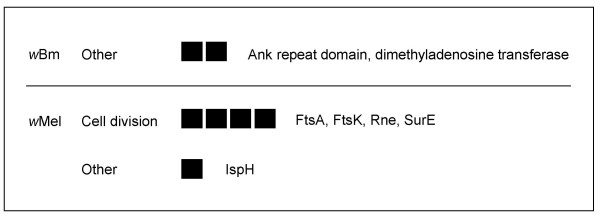
Figure 3.

Cellular processes. Specific genes and dN/dS exhibiting selection (BH p = 0.001 model and Fisher's exact test) by select functional role for each genome. Each box corresponds to a significant gene in the sub role and degree of shading indicates magnitude of dN/dS. "Unrep" indicates the ratio was at the reportable limit of codeml (see methods). Names of gene products are listed in order to the right of boxes. See Additional file 1 for individual p values, gene ids/descriptions, WD#s, and dN & dS values.
