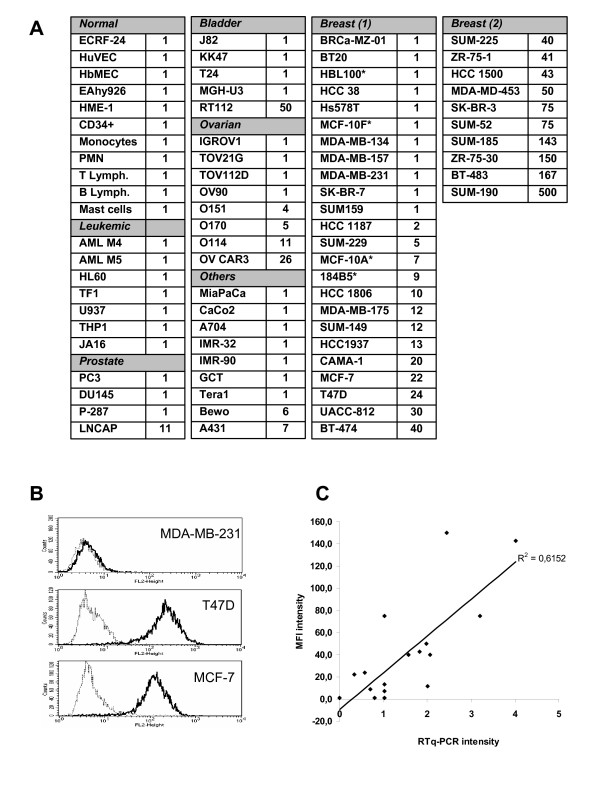
Figure 1.

Analysis of Nectin-4 expression in normal and tumor cells. A: Cell surface expression of Nectin-4 was assessed by FACS analysis using the N4.61 mAb. The level of cell surface expressed Nectin-4 (L) was calculated in arbitrary units based on fluorescence intensity: L = MFI N4.61/MFI control IgG1. Similar results were obtained with the N4.40 mAb. L = 1 corresponds to negative cell lines, 2 < L < 15: low expression, 16 < L < 50: intermediate expression, L > 50 high expression. These results are representative of at least three independant experiments. *, non cancerous breast cell lines. B: Nectin-4 expression level on breast tumor cell lines was monitored by FACS analysis using the anti-Nectin-4 N4.61 mAb (black line) and compared with a mouse irrelevant IgG1 (gray line). Examples of a negative cell line (MDA-MB-231) and two intermediate expressing cell lines (T47D and MCF-7). C: Correlation between Nectin-4 cell surface expression and Nectin-4 transcriptional expression. Quantitative PCR was performed on 17 breast tumor cell lines. Values were calculated as described in material and methods. The results are representative of at least two experiments.
