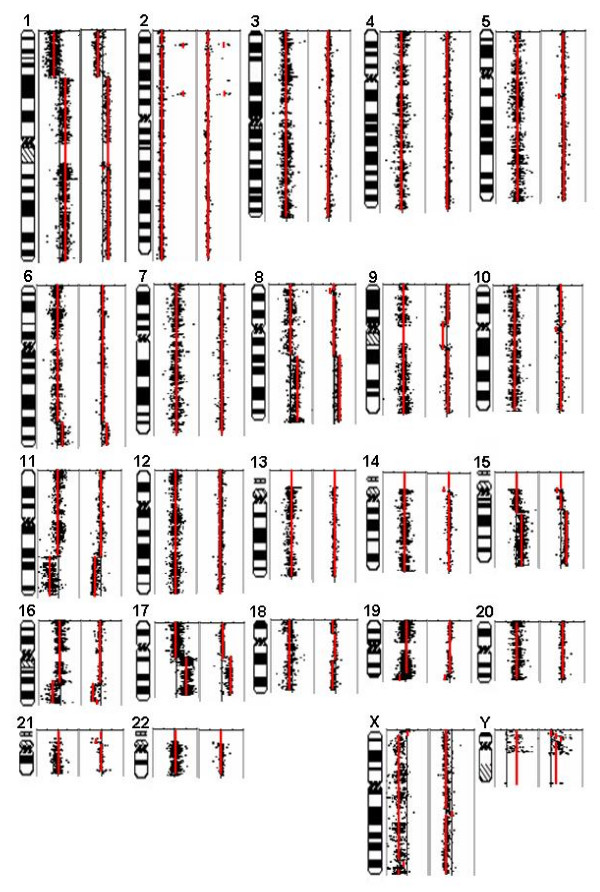
Figure 2.

DNA copy number variation in IMR-32 cells measured by graCNV (left) and BAC aCGH (right). log2 copy number differences relative to normal genomic DNA are shown on a scale from -2 to +2, except for chromosome 2 (-2 to +8). log2 copy numbers inferred from CBS are shown as red lines for segments > 1 Mb. Measurements are plotted along the physical map of chromosomes.
