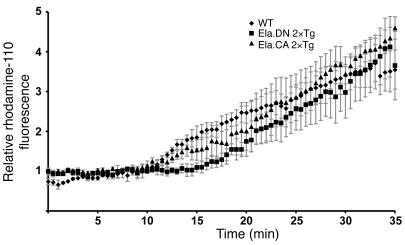
Figure 5. Activation of trypsin in acini is independent of IKK2-DN and IKK2-CA expression.
Differential interference contrast and rhodamine-110 fluorescence images were collected throughout the equilibration period of isolated acini from wild-type, Ela.rtTA×IKK2-DN, and Ela.rtTAxIKK2-CA mice and after stimulation with supramaximal cerulein in vitro. Shown is quantitative evaluation of the relative fluorescence increase at the apical pole of at least 8 measurements for each genotype. Differences were not significant at 10, 20, and 30 minutes.

