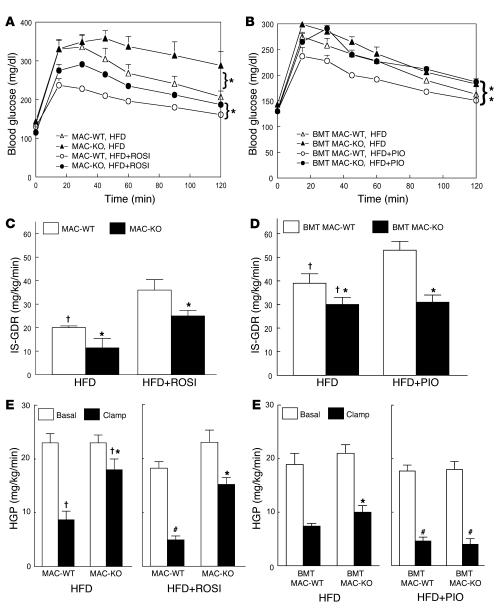
Figure 6. Macrophage-specific PPARγ deletion causes susceptibility to HFD-induced insulin resistance and diminished TZD effectiveness.
GTTs were performed on 12-month-old male MAC-KO versus MAC-WT mice fed a HFD with or without rosiglitazone (ROSI) (A) and 10-month-old male BMT MAC-WT versus BMT MAC-KO mice fed a HFD with or without pioglitazone (PIO) (B) for 8 weeks. Mean blood glucose concentrations ± SEM are shown for both groups of WT mice fed a HFD (open triangles) or HFD plus TZD (open circles) and for both groups of KO mice fed a HFD (filled triangles) or HFD plus TZD (filled circles). *P < 0.05; statistical differences were determined using repeated-measures ANOVA. (C and D) IS-GDR was determined in both groups of HFD-fed TZD-treated and untreated WT (MAC-WT and BMT MAC-WT; white bars) and KO (MAC-KO and BMT MAC-KO; black bars) mice. HGP at basal conditions (white bars) and during insulin stimulation (black bars) was determined for MAC-WT and MAC-KO (E) and for BMT MAC-WT and BMT MAC-KO (F) mice. Values are expressed as mean ± SEM (n = 5–7 mice/group). Significant differences were detected using 1-way ANOVA. †P < 0.05, NC (Figure 2, C–F) versus HFD, within genotype; *P < 0.05 between genotypes within diet and condition; #P < 0.05, HFD versus HFD plus TZD, within genotype and condition.

