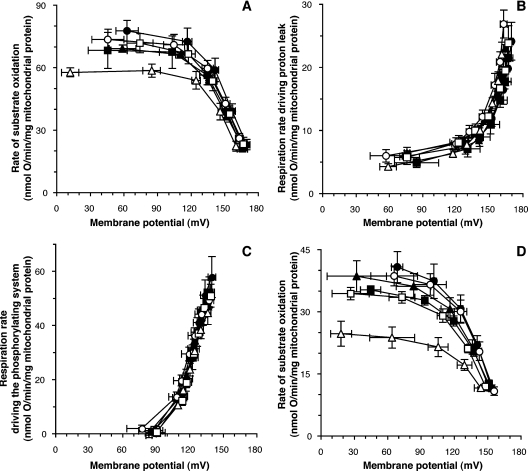
Figure 3. Modular kinetic analysis: full dataset.
The Figure shows modular kinetic analysis in mitochondria isolated from cybrids, using succinate as substrate, of (A) substrate oxidation, (B) proton leak and (C) the phosphorylating system. (D) Modular kinetic analysis of substrate oxidation using α-oxoglutarate+malate as substrate. Closed symbols, Arctic haplogroups (circles, haplogroup A; squares, haplogroup C; triangles, haplogroup D); open symbols, tropical haplogroups (circles, haplogroup L1; squares, haplogroup L2; triangles, haplogroup L3). Data are means±S.E.M. for three cell clones; there were three or four (A, B and C) or one (D) repeat(s) using independently prepared mitochondria for each clone. The kinetic response of the phosphorylating system to Δψ was calculated by subtracting respiration driving proton leak from respiration driving the Δψ-consumers at each value of Δψ.

