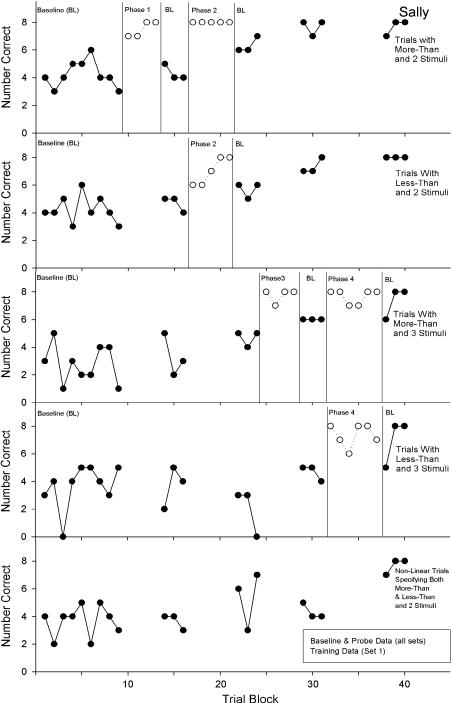
Figure 4. Results for Sally.
The top graph presents data from more than linear trials with two pictures. The second graph presents data from less than linear trials with two pictures. The third graph presents data from more than linear trials with three pictures. The fourth graph contains data from less than linear trials with three pictures. The fifth graph presents data from more than and less than nonlinear trials with three pictures.

