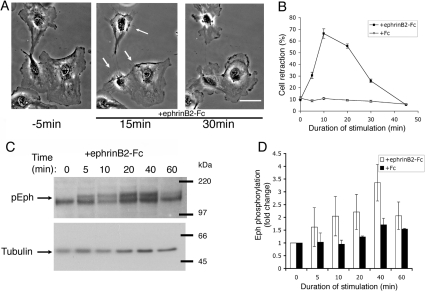
Figure 1. Retraction–recovery response of HUVECs to ephrinB2–Fc.
(A) Time-lapse movie stills (pre-clustered ephrinB2–Fc added at 0 min; arrows indicate regions of cell retraction; see also Supplemental Movie S1 at http://www.BiochemJ.org/bj/404/bj4040023add.htm). Scale bar, 30 μm. (B) Cell retraction in response to pre-clustered ephrinB2–Fc or control Fc (n=5, >100 cells/condition). Molecular masses are given in kDa. (C, D) Time course of phosphorylation of Eph receptors (pEph) in response to ephrinB2–Fc. Results are means±S.E.M. (n=3).

