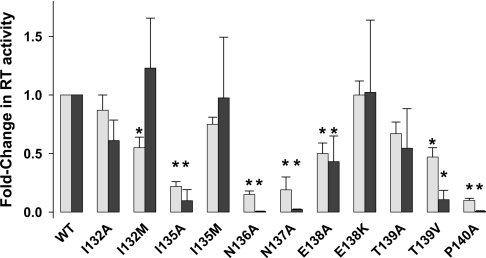
Figure 2. Activity of mutant HIV-1 RT determined using recombinant purified enzymes or the TyHRT assay.
Data are reported as an average±S.D. of at least three separate experiments. The grey and black bars represent the fold-change in RT activity using recombinant purified enzymes (grey bars) or the TyHRT assay (black bars). *P<0.01 compared with WT (Student's t test).

