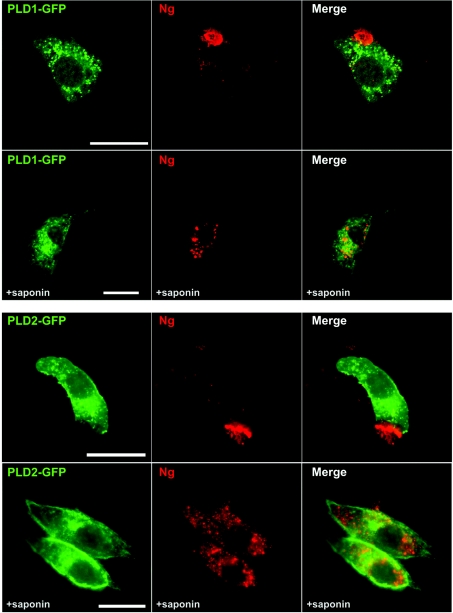
Figure 6. Effects of PLD overexpresion on Ng subcellular distribution.
NIH-3T3 cells were transfected with Ng and either PLD1–GFP (upper panels) or PLD2–GFP (lower panels) and analysed using the cool IF method before (upper rows) or after (lower rows) 60 s of in situ permeabilization with saponin. Note that Ng labelling at the plasma membrane is restricted to a peripheral patch that showed strong fluorescence. After saponin extraction, Ng is observed in perinuclear (PLD1) or dispersed cytoplasmic (PLD2) vesicles. These vesicles were bigger than those observed without PLD overexpression. No co-localization between Ng and PLDs was observed. Scale bar, 25 μm.

