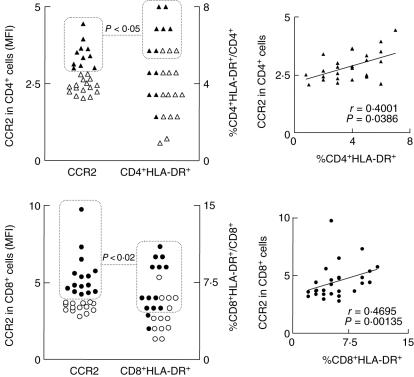
Fig. 5.
Analysis of CCR2 chemokine receptor expression and the frequency of human leucocyte antigen D-related (HLA-DR+) cells within CD4+ (top panels) and CD8+ lymphocytes (bottom panels) in peripheral blood of healthy volunteers following first-time 17DD yellow fever (YF) vaccination. Data are expressed as scattering of individual values corresponding to the mean fluorescence intensity of CCR2 expression and the frequency of HLA-DR+ cells within CD4+ and CD8+ cells, respectively. Dotted rectangles and lines highlight at individual level the significant association (χ2P-values < 0·05) between the expression of CCR2 and the frequency of HLA-DR+ cells within the CD4+ (▵, ▴) and CD8+ T cells (○, ●). Confirmatory correlation analysis validates the association between the expression of CCR2 by CD4+ and CD8+ T cells with the frequency of activated cells within a given T cell subset. Correlation indexes (r and P-values) are provided in the figure.

