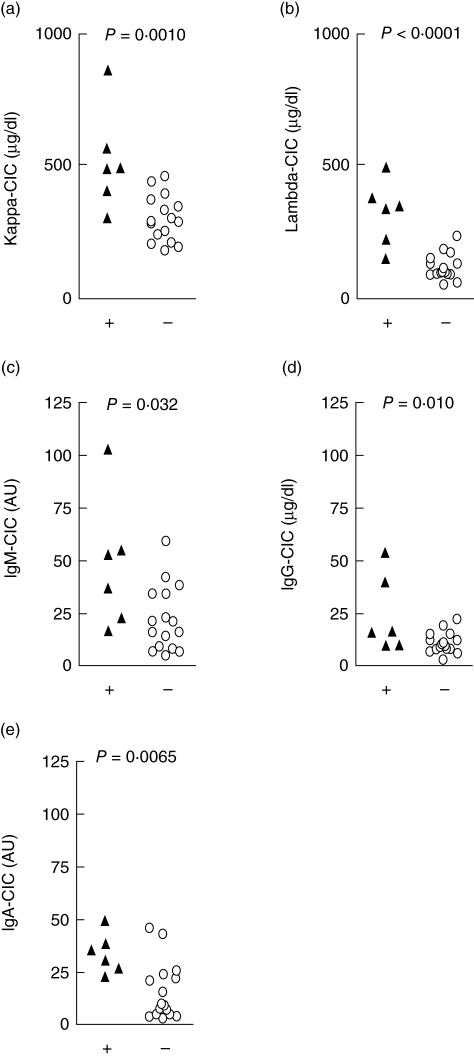
Fig. 2.
Comparison of the levels of circulating immune complexes (CICs) measured by their content of kappa (a) and lambda (b) chains and also the individual Ig isotypes (c–e: IgM, IgG and IgA) in the six C2-deficient patients (black triangles) compared to controls with normal C2 and mannan-binding lectin (MBL) (open circles).

