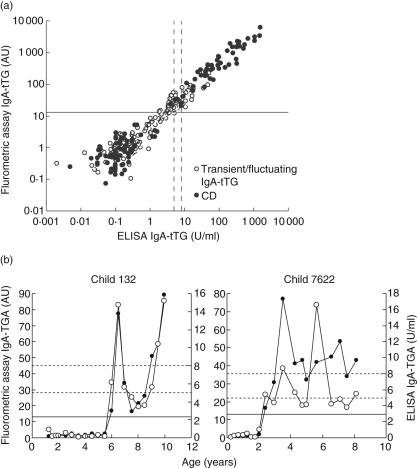
Fig. 1.
(a,b) Correlation between the fluorometric assay and enzyme-linked immunosorbent assay (ELISA) (Celikey™). (a) The immunoglobulin A (IgA)–tissue transglutaminase (TGA) values of all the 259 follow-up samples analysed by the fluorometric assay were plotted against the corresponding ELISA results, R = 0·93. The cut-off level of the fluorometric assay is marked with a solid line, while the equivocal zone of the ELISA is indicated by dotted lines. (b) Two children showing fluctuating IgA–TGA in the ELISA (○) presented continuous autoantibodies from seroconversion onwards as measured in the fluorometric assay (•), cut-off levels marked as in (a).

