
Figure 6.
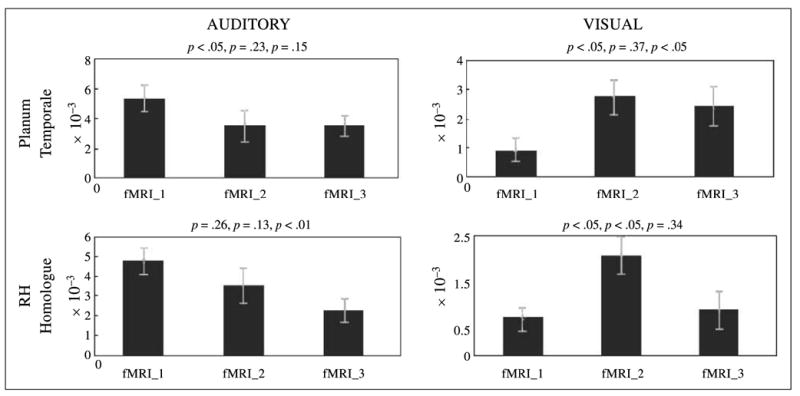
Statistical comparison of percent signal change (based on extracted beta values) during sentence processing epoch of fMRI Sessions 1, 2, and 3. Results are plotted for PT and its RH homologue in the auditory and visual groups. Above each graph are p values for t tests (corrected for multiple comparisons) between Sessions 1 and 2, 2 and 3, and 1 and 3, respectively.