
Figure 1.
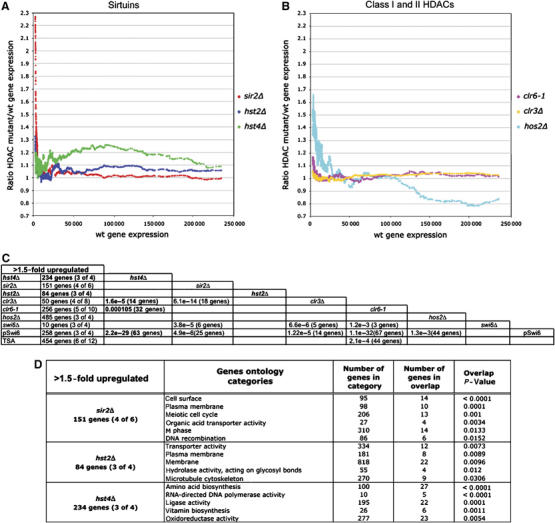
Expression profiling of HDAC mutants. (A, B) Moving average plots (window size=150; step size 1) of the median gene expression ratio mutant/wt plotted as a function of average transcription levels of 11 wt measurements of cultures in mid-logarithmic growth phase (using an arbitrary scale 0–250 000; data from Wiren et al (2005)). (C) The number of genes 1.5-fold upregulated in the different HDAC mutants are shown. The numbers within parentheses indicate the number of measurements, which fulfill the threshold limits, that is (4 of 6), four of six data points were above the 1.5-fold cut-off. New data on Sirtuins as part of this study are shown in bold letters. The other data are from Wiren et al (2005). The significance of overlaps between the gene lists is indicated by the hypergeometric probabilities, and the numbers of shared genes between the data sets are cross-tabulated. (D) The result of ‘GoMiner' analysis of genes derepressed in Sirtuin mutants (as indicated). The most significant gene ontology categories, the number of genes in each category, the number of genes in overlap and the P-values (two-sided Fisher's exact test) indicating the significance of the overlap are indicated.