
Figure 3.
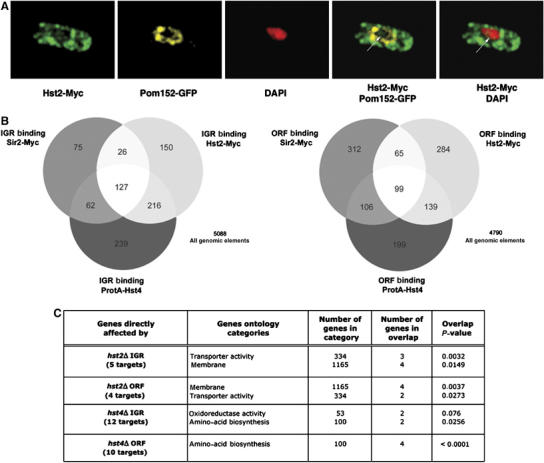
A nuclear pool of Hst2 shares chromatin binding targets with other Sirtuins in ORF and IGR regions (A) Deconvolved IF images of cells (Hu1627, Hst2-myc pom152-GFP) stained with DAPI (blue) anti-GFP (green) and anti-myc (red). Hst2-myc is mainly cytoplasmic, but a small fraction of Hst2-myc is localized at chromatin (arrow). (B) Venn diagrams illustrating the similarity of Sirtuin IGR and ORF binding data. (C) The result of ‘GoMiner' analysis of direct target gene. repressed by Hst2 and Hst4 (see main text for details). The most significant gene ontology categories, the number of genes in each category, the number of genes in overlap and the P-values (two-sided Fisher's exact test) indicating the significance for the overlap are indicated (see Materials and methods).