
Figure 2.
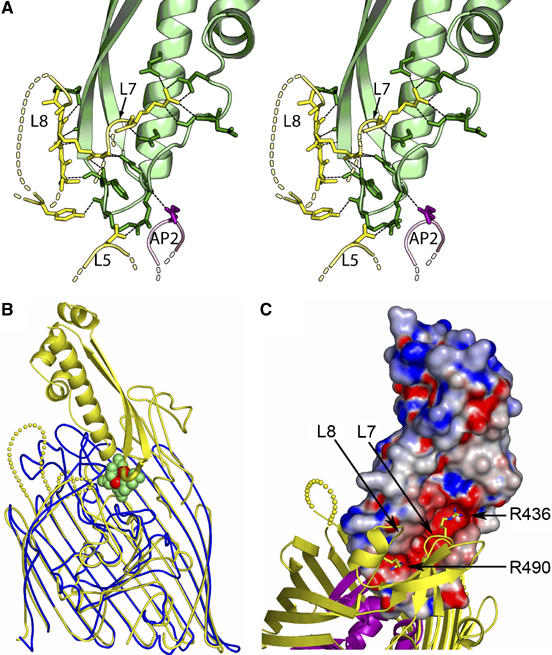
Recognition of Cir by colicin Ia. (A) Stereo illustration of the colicin Ia binding site, contributed by Cir residues from extracellular loops 5, 7, and 8, and from plug apical loop 2. Cir is colored yellow (barrel) and magenta (plug), and the R-domain of colicin Ia is colored green. H-bonds are shown as black dashed lines. Residues and distances are described in detail in the Supplementary data. (B) Superposition of the Cir–colicin complex (yellow) with E. coli ferric citrate receptor (blue) in complex with diferric dicitrate (green and red) (PDB ID 1PO3). The front strands of the beta barrels for both receptors have been removed for clarity. The loop (yellow tube) connecting the two beta strands of the colicin R-domain sits at approximately the same depth in the binding pocket as diferric dicitrate (green (citrate) and red (iron) spheres), mimicking siderophore binding. (C) Charge complementarity between the R-domain of colicin Ia and extracellular loops 7 and 8 of Cir. The R-domain of colicin Ia is shown in surface representation, colored by electrostatic potential using values of −10 to +10 kt from GRASP (Nicholls et al, 1991). Cir is drawn and colored as in Figure 1. Two arginine residues on Cir insert into the negatively charged groove on colicin Ia; R436 from loop 7 and R490 from loop 8 form multiple interactions with colicin Ia, and are drawn in stick representation. Other Cir–colicin Ia interactions are described in the text and in Supplementary Table II.