
Figure 4.
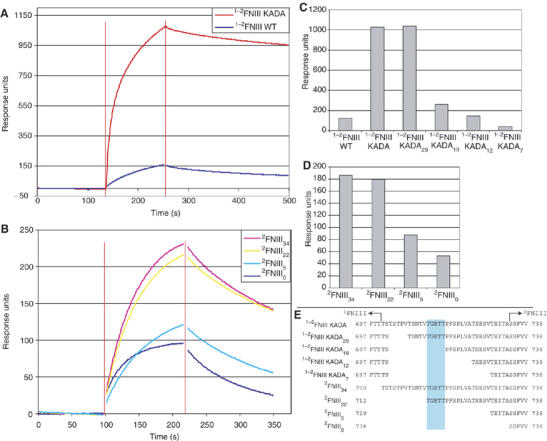
1−2FNIII–FN30 kDa interaction. Shown here are sample SPR sensogram traces of (A) the interaction of wild-type 1−2FNIII and 1−2FNIII KADA (5 μM protein concentration) and (B) the interaction of different 2FNIII linker length variants (20 μM protein concentration) with immobilized FN30 kDa. Data points close to injection start and end (denoted by red vertical lines) were removed for clarity. (C, D) Response levels at a time point 50 s after the end of the injection for the interaction of (C) different 1−2FNIII variants (5 μM protein concentration) and (D) different 2FNIII variants (20 μM protein concentration) with immobilized FN30 kDa. (E) The amino-acid sequences of the interdomain linker for the different 2FNIII and 1−2FNIII variants are shown here. The 1FNIII end and the start of the structured part of 2FNIII are denoted. Highlighted in cyan are linker residues, removal of which significantly affects FN30 kDa binding.