
Figure 1.
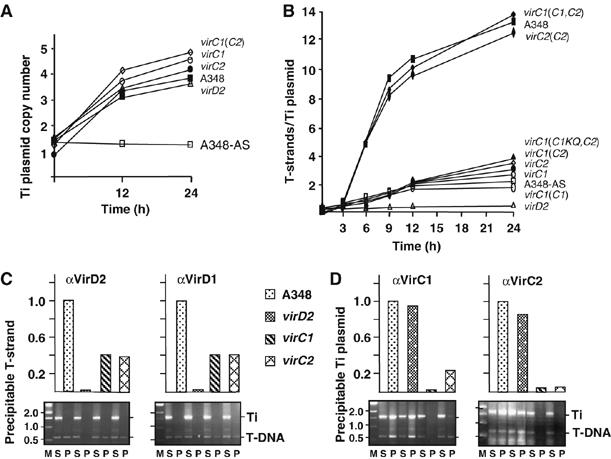
Quantitative effects of VirC1 and VirC2 on generation of the T-DNA transfer intermediate. (A) Increase in Ti plasmid copy number in response to AS induction. Strains: A348 WT strain; virD2, Mx311; virC1, Mx365 (this mutation is polar on downstream virC2); virC2, Mx364; virC1(C2), Mx365(pKA114) producing VirC2 from the IncP replicon. All strains except for A348-AS were induced with AS for the times indicated at 22°C. (B) Effects of VirC proteins on cellular levels of T-strand. Strains: same as (A) plus virC1(C1,C2), Mx365(pKAB188) producing VirC1 and VirC2 from an IncP replicon; virC1(C1KQ,C2), Mx365(pKAB190) producing VirC1K15Q, and VirC2 from an IncP replicon. T-strand levels were determined as described in the text. (C, D) Effects of VirC proteins on accumulation of the VirD2–T-strand intermediate. Strains listed at center were treated without (for VirD2) or with (for VirD1, VirC1, and VirC2) formaldehyde before cell lysis. Antibodies listed at the top of each histogram were used to immunoprecipitate the cognate Vir protein. Levels of co-precipitated T-strand or Ti plasmid were determined by quantitative (upper histogram) and nonquantitative (lower gel) ChIP (TrIP) assays as described previously (Cascales and Christie, 2004b). Upper histogram: T-strand or Ti plasmid levels in WT strain A348 are normalized to 1.0, and levels in vir mutant strains are depicted as a fraction of WT levels. Lower gel: agarose gels showing PCR amplification products generated with primers against a Ti plasmid gene fragment (Ti) and a T-DNA fragment (T-DNA). Lanes: M, molecular mass markers with sizes in kb listed at left; PCR products were generated using supernatant (nonprecipitated) (S) and immunoprecipitated (P) material.