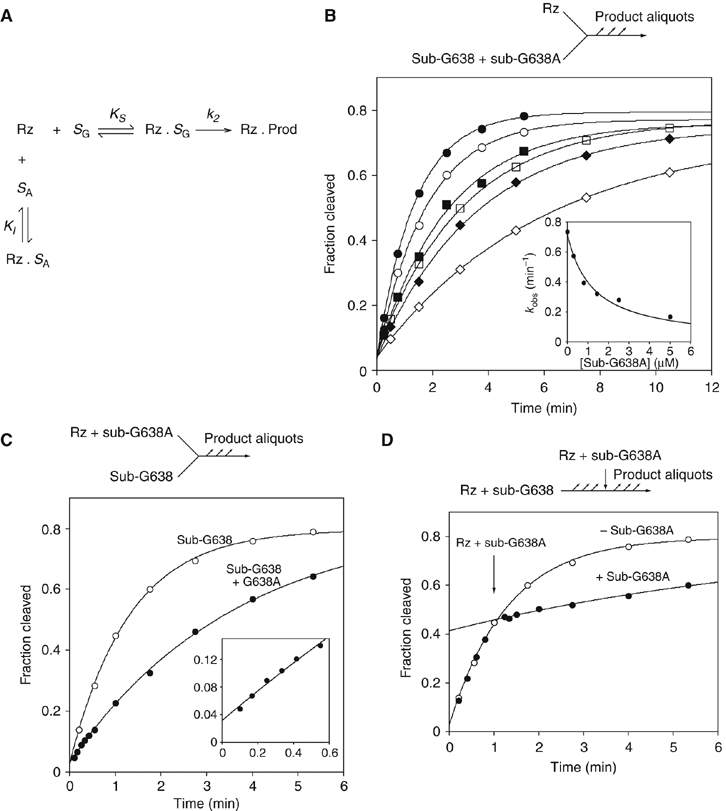
Figure 4.

Affinity and rate of substrate binding in trans to the VS ribozyme. (A) Reaction scheme for the ribozyme cleavage in the presence of the variant substrate. The natural sequence substrate (SG) binds to the ribozyme (Rz) with an affinity KS to form a non-covalent complex that undergoes the cleavage reaction at rate k2. The G638A substrate binds to the ribozyme with an affinity KI. The variant substrate undergoes a negligible amount of cleavage during the incubation, and therefore simply acts as an inhibitor of the reaction. (B) Cleavage of a natural sequence substrate by VS ribozyme was performed in trans under standard single-turnover conditions in the presence of different concentrations of G638A substrate. Progress curves are shown for reactions carried out in the presence of the following concentrations of G638A substrate: 0 (filled circles), 0.3 (open circles), 0.8 (filled squares), 1.4 (open squares), 2.5 (filled diamonds) and 5 μM (open diamonds). In the inset, the observed rate constants (kobs) are plotted as a function of G638A substrate concentration and fitted to equation 1, appropriate for competitive inhibition by the variant substrate. (C) Substrate cleavage by VS ribozyme that had been preincubated with G638A variant substrate. Ribozyme (1 μM, with or without 2.8 μM G638A substrate) and substrate were separately incubated followed by mixing together at 0 time. The progress of both reactions is shown: no G638A substrate (open circles); plus G638A substrate (filled circles) and fitted to single exponentials, yielding rates of 0.77±0.03 and 0.28±0.01 min−1. The data for the first 0.6 min are shown expanded in the inset. Note that no lag phase is discernible. (D) A VS cleavage reaction interrupted by addition of G638A substrate. A cleavage reaction was initiated by addition of 10 μl of 1 μM ribozyme to 10 μl of natural sequence substrate, followed by addition of 10 μl of 30 μM G638A substrate, 1 μM ribozyme after 60 s. Progress curves are plotted for the interrupted reaction (filled circles) and one reaction allowed to continue normally (open circles; these data are taken from panel C), and fitted to single exponentials. There is no discernible intermediate phase, and the curves intersect at 64.8 s.
