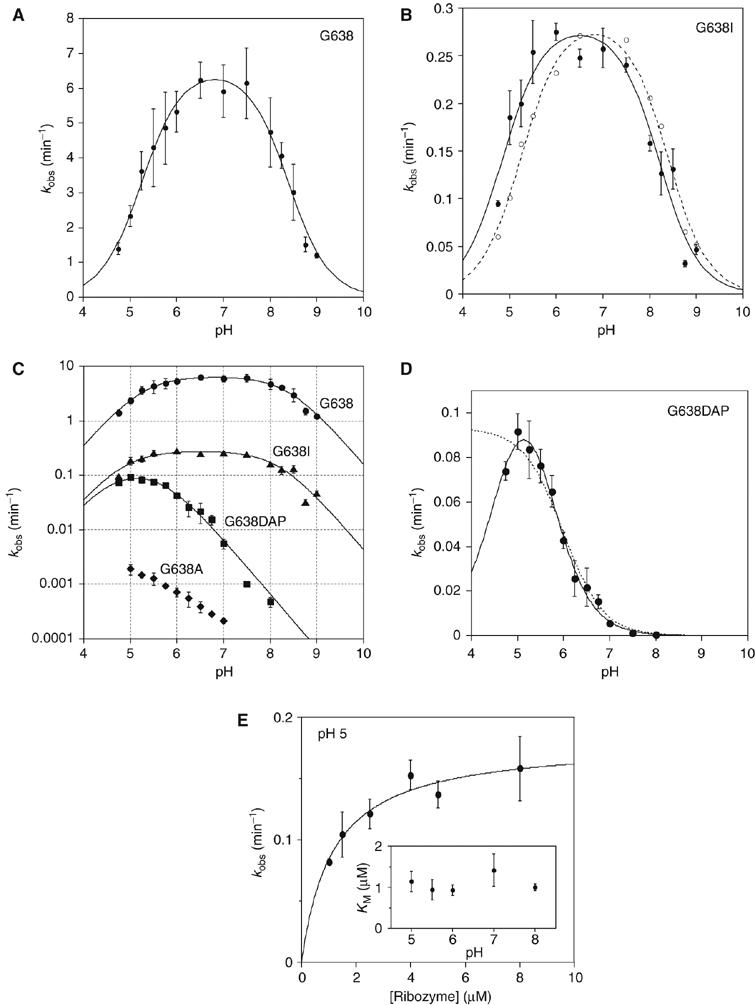
Figure 7.

pH dependence of observed rates for VS ribozyme cleavage reactions in trans with the natural and modified substrates. Cleavage reaction rates were measured under single-turnover conditions in 50 mM MES, HEPES or TAPS of required pH containing 200 mM MgCl2 and 25 mM KCl. All rates are averages of ⩾3 measurements, and the error bars indicate one standard deviation. All data have been fitted to a double-ionization model in which there is a requirement for one protonated and one deprotonated form (equation 2), from which apparent pKA values have been determined. (A) The pH dependence of the rate of cleavage of the natural sequence substrate. The data are well fitted by the double-ionization model model, giving apparent pKA values of 5.2±0.1 and 8.4±0.1, and an intrinsic rate of 6.6 min−1. (B) The pH dependence of the rate of cleavage of the G638I substrate. The data (filled circles) are fitted (continuous line) to the double-ionization model model, giving pKA values of 4.8±0.1 and 8.2±0.1, and an intrinsic rate of 0.29 min−1. The data (open circles) and fit (broken line) for the natural sequence substrate (scaled to the intrinsic rate of the G638I reaction) reveal significant shifts of reaction pKA values for the modified substrate. (C) The data for four substrates plotted as the log10 of the observed rate as a function of pH. The grid facilitates estimation of the gradients. Natural sequence substrate, circles; G638I substrate, triangles; G638DAP, squares and G638A, diamonds. (D) The pH dependence of the rate of cleavage of the G638DAP substrate. The reaction is accelerated at lower pH values, and a clear maximum is observed at pH 5. The data have been fitted to single- (broken line; equation 3) and double (unbroken line)-ionization models. The fit to the double-ionization model gives pKA values of 4.6±0.2 and 5.6±0.1 and an intrinsic rate of 0.15 min−1. (E) The KM for the G638DAP substrate. Rates of cleavage by the trans-acting VS ribozyme were measured as a function of ribozyme concentration over a range of buffer pH. Each rate was plotted and fitted to equation 4, from which values of KM and k2 were calculated. The data for pH 5 are shown. The variation of KM over the range of pH between 5 and 8 is plotted (inset).
