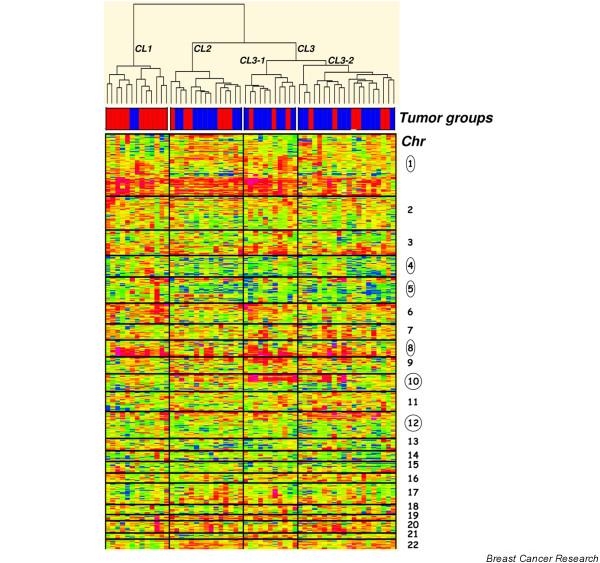
Figure 2.

Dendro-heatmaps of the unsupervised clustering by tumors. The standardized copy number log ratio of all autosomal chromosome loci is shown according to a color scale (top). Tumor groups are distinguished with a color code at the bottom of the dendrogram: red, basal-like carcinomas; blue, medullary breast carcinomas.
