
Figure 3.
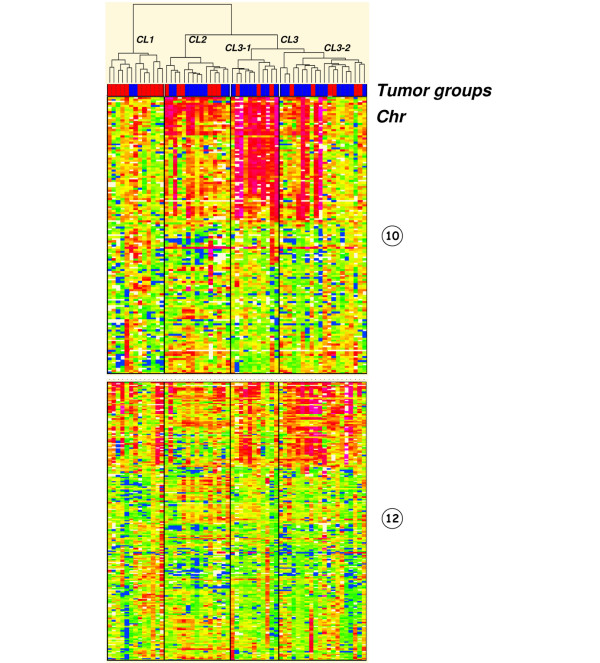
Dendro-heatmaps of chromosomes 10 and 12. Cluster 3-1 shows a more marked gain of the 10p region than in the other clusters. Tumor groups are distinguished with a color code at the bottom of the dendrogram: red, basal-like carcinomas; blue, medullary breast carcinomas.