
Figure 1.
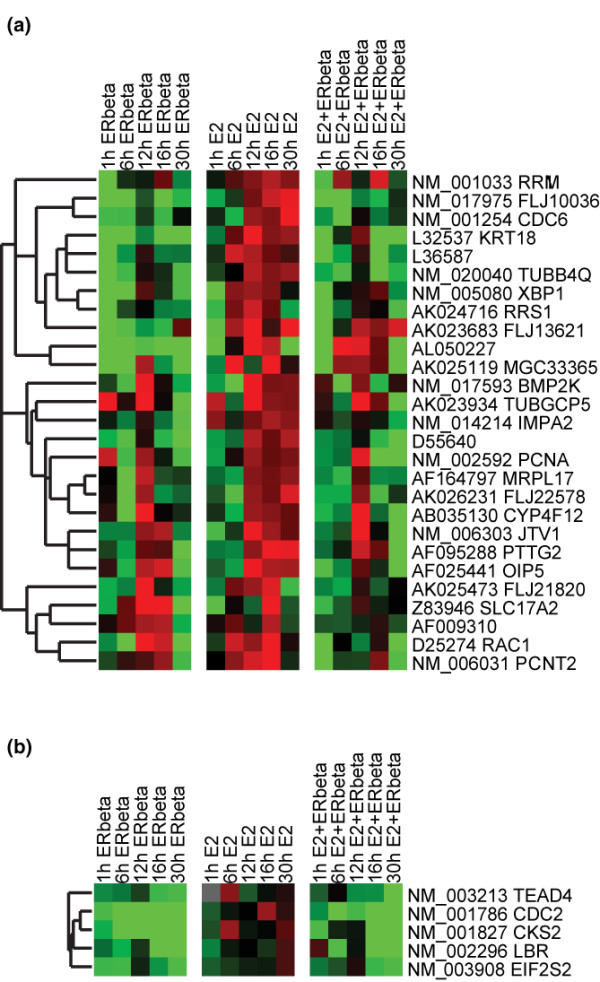
Two clusters of genes showing disruption of estrogen-responsive expression profiles by estrogen receptor beta (ERβ) overexpression. (a) The columns represent time points arranged in chronological order, and each row represents the expression profile of a particular gene. By convention, upregulated genes are indicated by red signals and downregulated genes are indicated by green. The magnitude of change is proportional to the brightness of the signal. (b) Second cluster of genes disrupted by ERβ overexpression.