Figure 5.

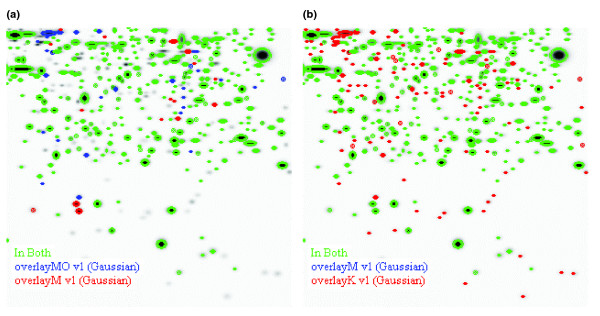
Overlaid gel images. Gaussian images of mDCs were overlaid with those of either (a) moDCs or (b) KG-1 cells. This reveals differences in the proteomes, with some unique spots.

Overlaid gel images. Gaussian images of mDCs were overlaid with those of either (a) moDCs or (b) KG-1 cells. This reveals differences in the proteomes, with some unique spots.