
Figure 1.
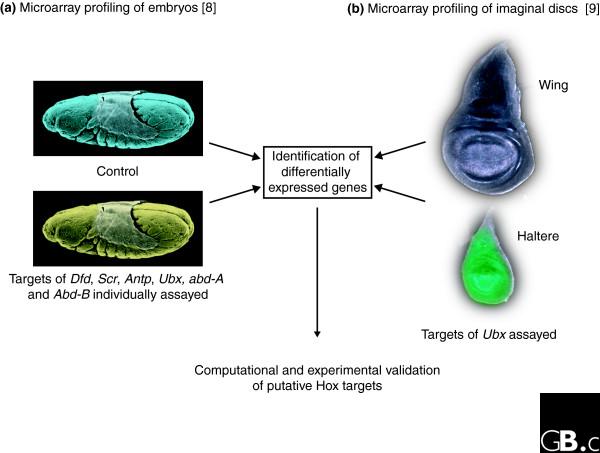
Microarray expression profiling for identification of Hox downstream targets. (a) Hueber et al. [8] compared Drosophila embryos overexpressing a control lacZ gene (blue) with embryos individually overexpressing various Hox genes (yellow). (b) Hersh et al. [9] searched for targets of Ultrabithorax (green) in haltere imaginal discs by comparing their transcriptome with that of wing imaginal discs (gray).