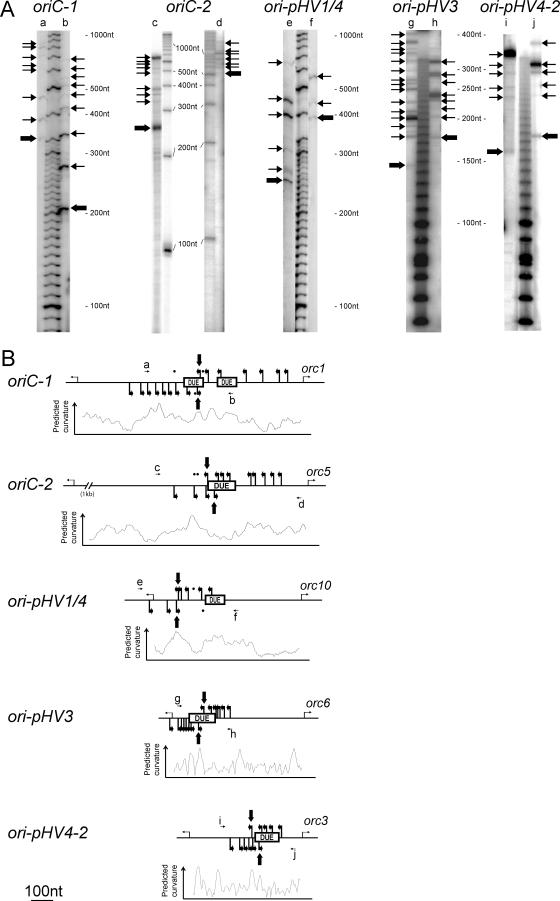
Figure 7. Mapping of Initiation Sites at the Replication Origins.
(A) Primer extension reactions were performed with enriched replicating intermediate DNA fragments and separated on a denaturing polyacrylamide gel. Corresponding primers are indicated on top of the gels (see Table S1 for details), arrows refer to the 5′ end of amplification products and transition points are indicated by bold arrows.
(B) Primers and detected initiation sites along the sequence. The positions of DUEs, the associated cdc6/orc1 gene on the right, and the upstream open reading frame on the left are shown for each replication origin. Dots indicate weak amplification products obtained with control templates (linearized plasmid DNA carrying the replication origins, isolated from E. coli cells).

