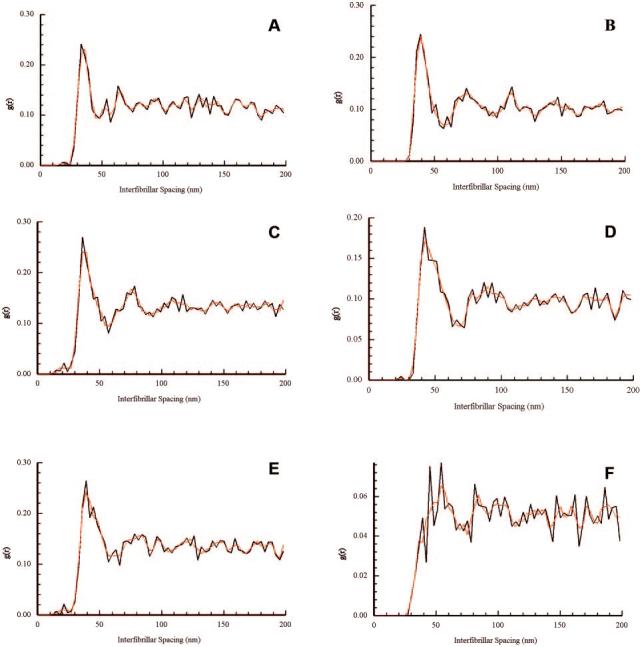
Figure 6.

Radial distribution functions g(r) of wild-type (A, C, E) and knockout (B, D, F) mouse corneas, in the anterior (A, B), mid (C, D), and posterior (E, F) stroma. Initial maxima were observed between 30 to 40 nm, with secondary maxima occurring at 70 to 90 nm throughout the wild-type corneas and in the anterior and mid regions of the Dpt−/− corneas (A–E). In contrast, posterior regions of Dpt−/− stroma showed a proportion of near neighbor fibrils at approximately 40 nm, but no clear indication of a first order peak or in the short-, medium-, and long-range orders (F). The function g(r) represents the relative probability of finding fibril centers at a distance r from any given reference fibril.
