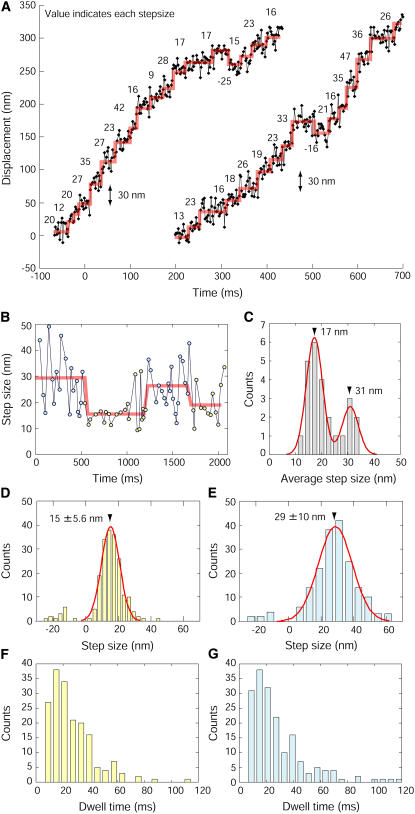
FIGURE 5.
Stepwise movements of the transport of the vesicles beneath the membrane. (A) Typical traces obtained for the transport beneath the membrane at 30°C. Red lines indicate the individual steps. Values are the sizes of each step detected by the computer programming. (B) Switching of the step size. Red lines indicate the stepwise changes of the step size. Yellow and cyan indicate the periods where the steps were small and large, respectively. (C) Histogram of the average step size until the step size changed. Data was fitted with the Gaussian distribution with peaks at 30.9 and 17.2 nm (n = 25). (D and E) Histogram of the step sizes for periods with small (D) and large steps (E). The peak of the Gaussian distribution fitted to the data for periods where the steps were small was 15 nm with a halfwidth of 5.6 nm (n = 202). The peak for the period where the steps were large occurred at 29 nm with a halfwidth of 10 nm (n = 188). (F and G) Dwell time of period where the steps were small (F) and large (G). The mean dwell time of period where the steps were small and large were 29 ms (n = 202) and 32 nm (n = 188), respectively.

