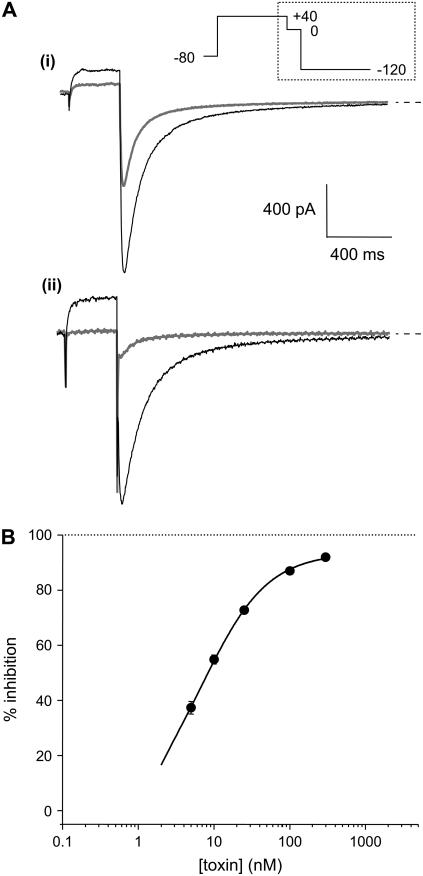
FIGURE 1.
(A) Typical examples of current traces recorded from CHO-cells stably expressing hERG channels before and 2 min after exposure to (i) 10 nM CnErg1 and (ii) 100 nM CnErg1. Cells were depolarized from a holding potential of −80 mV to +40 mV for 500 ms, then stepped to 0 mV for 100 ms and then to −120 mV for 1 s (only the last two voltage steps are shown). (B) Toxin concentration dependence of hERG current inhibition. Data points show the mean ± SE for n = 5–14 experiments. The solid line shows best fit of the Hill equation (see Materials and Methods) to the data with IC50 = 7.3 nM, n = 1.02, and % maximum block = 93.5%.

