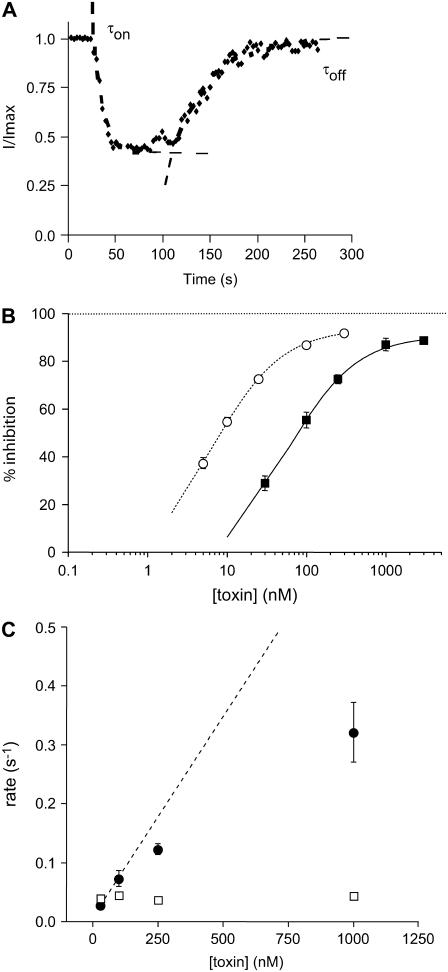
FIGURE 10.
Concentration-dependence of CnErg1 block of hERG currents at 37°C. (A) Typical example of the timecourse of current block and recovery during 120 s exposure to 100 nM CnErg1. Dashed lines are single exponential functions fitted to the onset and recovery from block. (B) Summary of the concentration dependence of steady-state block at 37°C (▴) and at 22°C (○, reproduced from Fig. 1 B). (C) Summary of toxin concentration dependence of the association (k+1.[toxin], •) and dissociation (k−1, □) rate constants for CnErg1 block of hERG currents at 37°C. Data points show mean ± SE for n = 4–7 experiments and the dashed line shows a straight line of best fit to the association rate constant data at low toxin concentrations.

