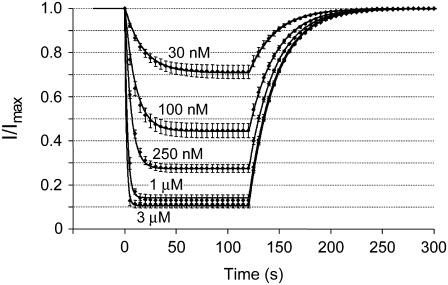
FIGURE 11.
Mean changes in hERG current magnitude recorded at 37°C during wash-on and wash-off of CnErg1 at concentrations ranging from 30 nM to 3 μM. Data points are mean ± SE for normalized current values from n = 4–7 experiments. The lines of best fit are derived from kinetic Scheme 2 using the 37°C values for k+1, k−1, k+2, and k−2, shown in Table 1.

