FIGURE 5.
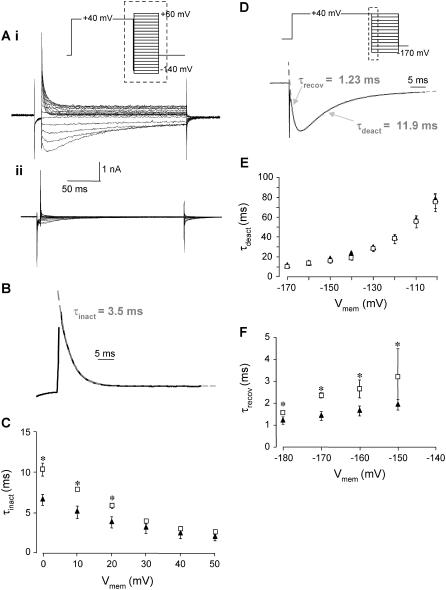
Effect of 1 μM CnErg1 on rates of inactivation, recovery from inactivation, and deactivation. (A) Typical examples of currents recorded during a protocol to measure rate of inactivation in the absence (i) and presence (ii) of 1 μM CnErg1. (B) A representative sweep recorded at +30 mV from the trace in (Ai) illustrating how time constants for inactivation were measured. The dashed shaded line is a single exponential fitted to the timecourse of inactivation giving a time constant of 3.5 ms. (C) Summary of changes in τinact between 0 and +50 mV in the absence (▴) and presence (□) of 1 μM CnErg1. Below 0 mV exponentials could not be accurately fitted to the data in the presence of CnErg1 due to the small magnitude of the currents. (D) Measurement of time constants for recovery from inactivation (τrecov) and deactivation (τdeact). Characteristically hooked tail currents recorded in response to the voltage protocol shown (see traces in Fig. 1 A) were fitted with a double exponential (dashed shaded line). The example shown is recorded at −170 mV. (E) Summary of τdeact over the voltage range −100 mV to −170 mV in the absence (▴) and presence (□) of 1 μM CnErg1. (F) Summary of τrecov over the voltage range −150 mV to −180 mV for control (▴) and 1 μM CnErg1 (□). Above −150 mV exponentials could not be accurately fitted to τrecov due to the small magnitude of the currents in the presence of CnErg1. P < 0.05.

