FIGURE 6.
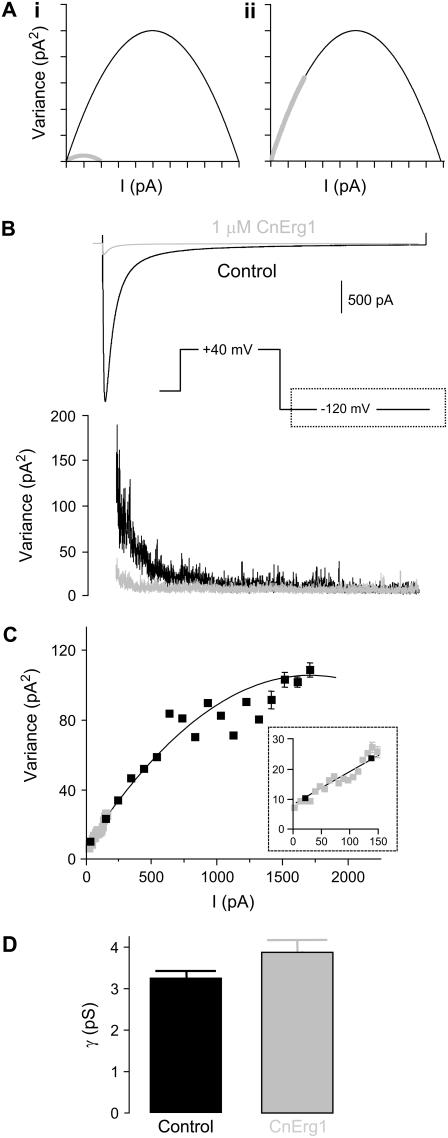
Nonstationary noise analysis. (A) Theoretical curves showing the effect of a reduction in single channel current amplitude from i to i/5 (i) and a reduction in nPo from 1 to 0.2 (ii) on mean current versus variance plots (see results for explanation). (B) Representative examples of leak-corrected mean current and ensemble variance as a function of time in the absence (solid traces) and presence (shaded traces) of 1 μM CnErg1. (C) Mean variance versus current plot for the traces in panel B for control (solid squares) and 1 mM CnErg1 (shaded squares). The solid line is a best fit of Eq. 3 (see Materials and Methods). The inset is a magnification of the boxed area highlighting that the data obtained in the presence of CnErg1 falls on the same line as the control data. (D) Bar graph showing mean single channel conductances calculated at −120 mV. There was no significant difference in conductance between control and in the presence of 1 μM CnErg1 (3.2 ± 0.2 pS and 3.8 ± 0.3 pS, respectively (mean ± SE, n = 5, P < 0.01)).

