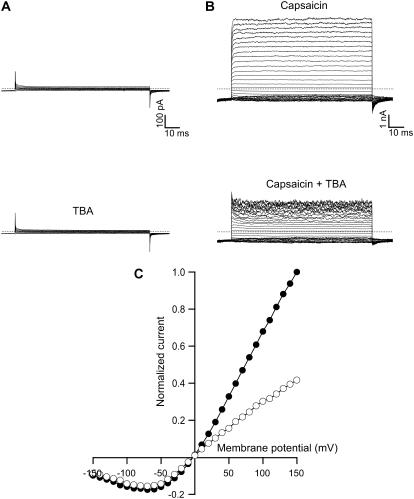
FIGURE 1.
Block of TRPV1 currents by intracellular TBA. (A) Currents from a nontransfected cell in the absence (top panel) and presence of 250 μM TBA (lower panel). (B) Current traces without TBA (top panel) and with 250 μM TBA (lower panel) in the same patch from a cell transfected with TRPV1. The currents were elicited by stepping membrane voltage from the 0 mV holding potential to −120 mV and then to various test potentials from −150 to 150 mV in 10 mV increments (see Materials and Methods). Currents in (B) were obtained in the presence of 4 μM capsaicin and corrected for background current in the absence of agonist. The dotted lines identify the zero current levels. (C) Normalized current-voltage plots obtained from the current traces shown in B (top panel, solid symbols and lower panel, open symbols). Data were normalized to the maximum current obtained in the absence of TBA at 150 mV.

