FIGURE 6.
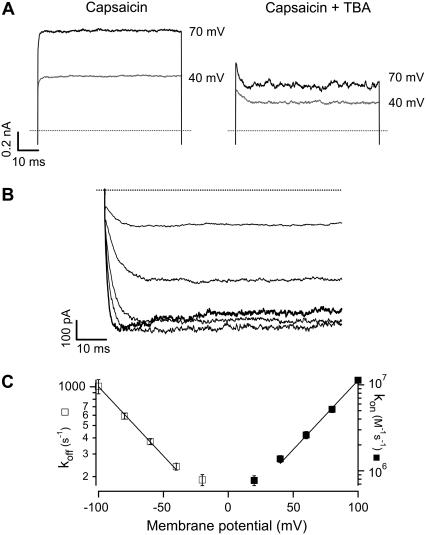
Kinetics of TBA block. (A) Currents recorded at the indicated membrane potential in the absence (left) and presence of 250 μM TBA (right). The onset of channel block is evidenced by the exponential current decay. (B) Recovery from channel block at negative voltages in the presence of 250 μM TBA. The patch was stepped to 60 mV and repolarized to record tail currents from −100 mV to −20 mV. The exponential increase of current is due to voltage-dependent unbinding of TBA from the channel. The trace at −100 mV is shown as a thick black line and reflects both unblocking and deactivation of the channel. (C) Voltage dependence of on- and off-rate constants. The off-rate constant koff was obtained from fits of a single exponential to records as in (B) and for kon, the inverse of the time constant of an exponential fitted to the current decay of records as in A (right) was plotted as a function of TBA concentration, and the slope used as an estimate of kon. The values of koff and kon as a function of voltage were fitted with an exponential function of voltage (Eq. 4) with parameters: kon(0) = 2.5 × 10⁵ M−1s−1, koff(0) = 83.76s−1, zon = 0.93 and zoff = −0.63. Symbols are the mean ± SE (n = 4).

