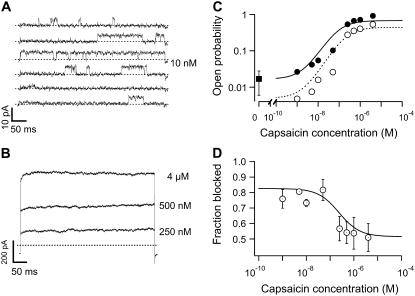
FIGURE 7.
State dependence of block by intracellular TBA. (A) Individual channel openings from a patch with 150 channels in the presence of 10 nM capsaicin. The open probability obtained from the ensemble-averaged idealized traces at 100 mV is 0.016. (B) Macroscopic currents elicited by the indicated concentration of capsaicin in the same patch as in (A). (C) Block of TRPV1 channels by TBA. The solid circles are the open probability in response to capsaicin obtained from dose responses as in (A) and (B). Open circles are the open probability in the presence of 250 μM TBA in the same patch. The square symbol is the value of the unliganded open probability determined from separate patches. The continuous line represents the prediction of Scheme 3 in the absence of blocker. The dotted curve is the prediction of Scheme 3, which allows block in the open state only. The parameters of the model are given in Table 2. (D) Fraction of blocked channels, fB,, as a function of capsaicin concentration. Data were transformed according to 1−(PB/P), where P is the open probability in the absence of blocker and PB is the open probability with blocker. The continuous curve is the prediction of Scheme 3 with the same parameters as in C. Symbols are the mean ± SE (n = 3).

