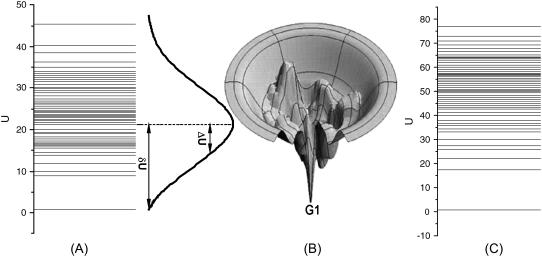
FIGURE 3.
The global structures and properties of the underlying potential landscape of the yeast cell cycle network. (A) The spectrum and the histogram or the distribution of the potential energy U. (B) An illustration of the funneled landscape of the yeast cell cycle network. The global minimum of the energy is at G1 state. (C) The spectrum of the potential energy U for a random network.

