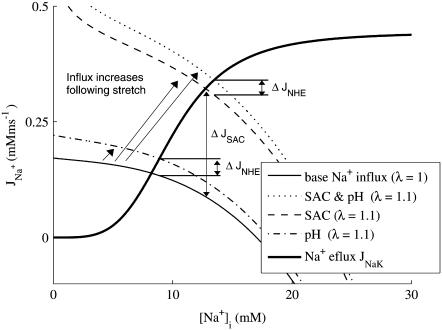
FIGURE 10.
Changes in Na+ influx and efflux in the presence of SAC and/or pH stretch-dependent elements, following stretch, in the quiescent cell. Fluxes are calculated as a function of [Na+]i with [K+]i, [Ca2+]i, [Ca2+]SR, and Vm clamped at their quiescent values of 144.19, 6.508 × 10⁻⁵, 0.6817 mM, and −79.90 mV, respectively. Na+ efflux through NaK (bold solid line), Na+ influx prestretch (solid line), and Na+ influx following 10% stretch in the presence of stretch-dependent NHE & AE (pH, dot-dashed line), stretch-dependent NHE & AE, and SAC (SAC & pH dotted line), and SACs (SAC dashed line). ΔJNHE indicates the change in Na+ flux caused by the addition of stretch-dependent NHE. ΔJSAC indicates the change in Na+ flux caused by the addition off SACs.

