FIGURE 3.
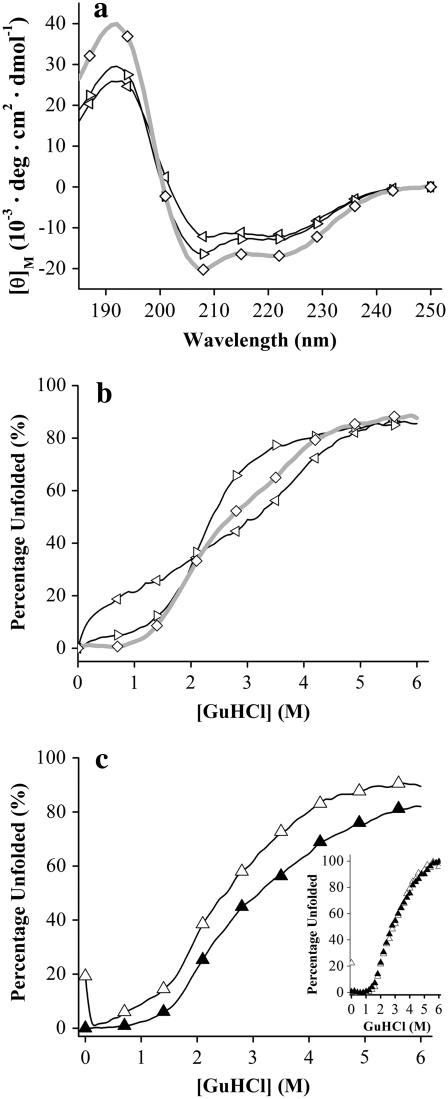
Circular dichroism studies of B6.4-17 and its subdomains. (a) CD wavelength scans of B6.4-13 (⋄), B6.4-10 (◃), and B9-13 (▹). Samples contained ∼5 μM protein in 5 mM potassium phosphate at pH 7.5, in a 1 mm cuvette at 25°C. Four scans with an averaging time of 5 s at every nm were collected and the average data are reported. (b) GuHCl titration of B6.4-13 (⋄), B6.4-10 (◃), and B9-13 (▹). (c) GuHCl titration of B6.4-17 (▵) and B6.4-17/DMPC complex (▴) at 1.2:1 L/P ratio. Native proteins in a 1 cm cuvette were titrated by the protein at the same concentration in 7 M GuHCl at 0.1 M per step at 25°C. After each injection of the denaturant, the sample was stirred for 3 min and the CD signal at 222 nm was averaged for 20 s. The raw CD data were converted to percentage unfolded by calculating the ratio between each data point and the CD signal at 0 M GuHCl as described in Materials and Methods. In the inset figure, the percentage unfolded curve was calculated by applying a folded baseline using the first 10 data points and using the CD signal at 6 M GuHCl as the unfolded reference.

