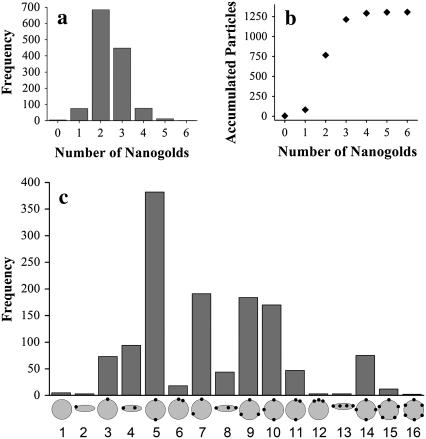
FIGURE 6.
Categories of nanogold-labeled particles. (a) Histogram of the number of nanogold on each particle. A total of 1315 particles were analyzed, and are categorized based on the number of nanogolds attached on each particle. (b) Accumulated plot of the nanogold count. Each data point represents the sum of the number of particles in this group plus the accumulated number of particles in the previous groups. (c) Histogram of the 16 geometrical groups. Nanogold-labeled particles were categorized into 16 geometrical groups as indicated at the bottom of the histogram. The number of particles counted in each group was plotted with shaded bars.

