FIGURE 4.
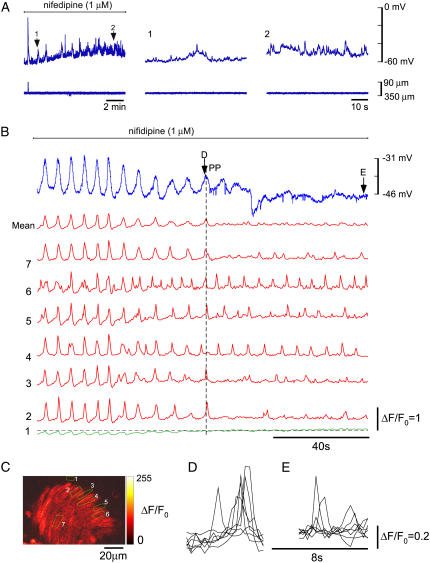
Effect of nifedipine. (A) Membrane potential recordings (upper traces) and simultaneous vessel edge recordings (lower traces) upon application of 1 μM nifedipine. L-NAME (30 μM), which like other NO synthase inhibitors (45) does not itself inhibit vasomotion, was included to inhibit NO release, because nifedipine has been reported to release NO from the endothelium (79). This figure is continued from Fig. 3 A where vasomotion had been initiated using 3 nM ET-1. Numbered arrows correspond to regions shown on an expanded timescale. (B) Membrane potential recordings (blue upper trace) and simultaneous record of [Ca2+]c for the seven ROIs marked in C, along with mean [Ca2+]c for the seven ROIs. ROI No. 1 was placed on the edge of the tissue so as to monitor tissue movements (green trace). Deflection of this trace below the dotted line shows tissue constriction, whereas upward movement above the dotted line is generated by actual increase in [Ca2+]c (verified by frame-by-frame analysis). (D and E) Superimposed ROIs (both axes scaled ×5) at arrow D (marked PP indicating pacemaker event) and E (Fig. 4 B).

