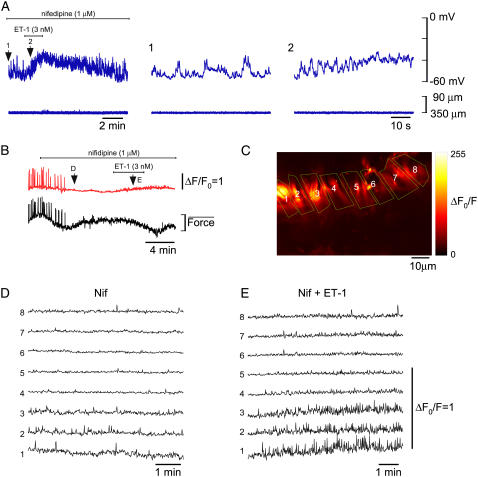
FIGURE 5.
Effect of ET-1 in the presence of nifedipine. (A) Membrane potential recordings (upper traces) and simultaneous vessel edge recordings (lower traces) upon application 3 nM ET-1 in the presence of 1 μM nifedipine. This figure is continued from Fig. 4 (L-NAME (30 μM) also added with nifedipine). Numbered arrows correspond to regions shown on an expanded timescale. (B) [Ca2+]c transients (upper record) averaged over all the imaged areas shown in C and associated smooth muscle constrictions (lower record) recorded from the lymphatic chamber of Fig. 3, B–E. Labeled regions show record sections analyzed below in corresponding panels. (C) Section of a lymphatic chamber showing Oregon green loaded smooth muscle with regions of interest used for data analysis. (D and E) Plots of relative [Ca2+]c as indicated on panel B (arrows D and E) obtained in the presence of 1 μM nifedipine before (D), and during application of 3 nM ET-1 (E). Force scale represents relative force.

