FIGURE 7.
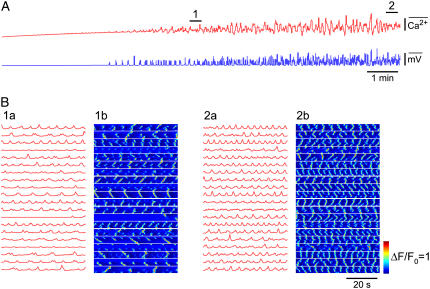
Role of L-type Ca2+ channels in model simulations. (A) Average Ca2+ (upper trace) and membrane potential response (lower trace) to increasing IP3 in the same simulation as for Fig. 6, with L-type Ca2+ channels blocked. (B) Regions marked with numbered bars in panel A shown in further detail. (B (1a)) Average Ca2+ changes in each cell shows asynchronous Ca2+ transients across the syncytium. (B (1b)) Space-time plot shows asynchronous Ca2+ transients and local Ca2+ waves within cells. (B (2a)) With increasing stimulation (i.e., [IP3]), the frequency of Ca2+ transients is increased but synchronous pacemaker Ca2+ transients do not arise. (B (2b)) Space-time plot shows further details of the store Ca2+ transients. Timescale bar in B (2b) applies to all traces and space-time plots in panel B. Ca2+ scale bar applies to all traces. All voltage and Ca2+ scale bars represent normalized values.

