
Figure 2.
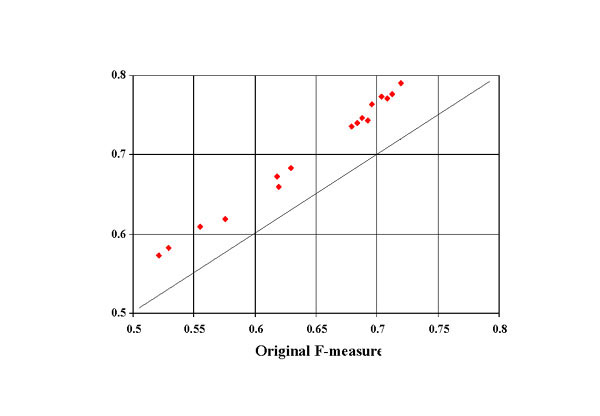
Changes in Participant's Mouse F-measures. Graph showing the differences between the participant's original F-measure and their final F-measure.
Official websites use .gov
A
.gov website belongs to an official
government organization in the United States.
Secure .gov websites use HTTPS
A lock (
) or https:// means you've safely
connected to the .gov website. Share sensitive
information only on official, secure websites.
Changes in Participant's Mouse F-measures. Graph showing the differences between the participant's original F-measure and their final F-measure.