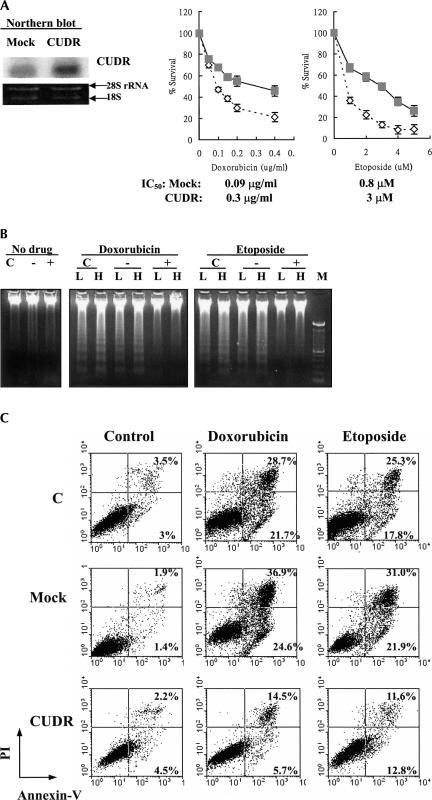
FIGURE 3.
CUDR overexpression-induced resistance to apoptotic cell death in cells upon drug treatment. (A) Stable expression of CUDR in A431 cells. The CUDR expression in mock and CUDR/pcDNA transfectants was assessed by Northern blot analysis. Sensitivity of A431 stable transfectants to doxorubicin and etoposide as detected by MTT assay. Cells were exposed to various concentrations of drugs for 48 h. Mock (empty vector) transfection (open diamond); CUDR/pcDNA transfection (gray square). Results show the mean value from four independent experiments, and error bars show 95% confidence intervals. (B) Drug-induced apoptosis in A431 cells as detected by a DNA fragmentation assay. The parent (C), mock (−), and CUDR (+) transfectants were exposed to doxorubicin ([L] 0.025 μg/mL, [H] 0.05 μg/mL) or etoposide ([L] 1 μM, [H] 2.5 μM) for 48 h. (M) 100-bp DNA marker. (C) Doxorubicin- and etoposide-induced apoptotsis in A431 cells assessed by annexin V-GFP/propidium iodide staining followed by flow cytometric analysis. Cells were stained with annexin V-GFP/PI after drug treatments for 48 h, and then analyzed for early apoptotic cells (bottom right quadrant) and late apoptotic or dead cells (top right quadrant). The percentages of cells in the two quadrants are shown.

