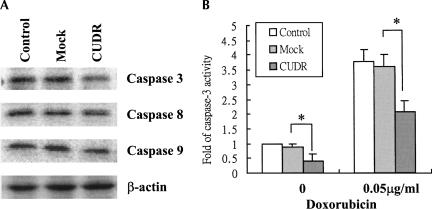
FIGURE 4.
(A) The basal protein levels of caspase 3, caspase 8, and caspase 9 in A431 cells. Twenty-five micrograms of total protein lysate were resolved in 15% SDS-PAGE and immunoblotted with the corresponding antibody by Western blot analysis. Experiments have been repeated at least three times, and the representative one is shown. (B) Effect of doxorubicin on caspase 3 activity in A431 cells. After treatment with 0.05 μg/mL doxorubicin for 48 h, the cells were trypsinized and lysed. Protein lysate was then subjected to a caspase 3 activity assay. Results show the mean value from four independent experiments, and error bars show 95% confidence intervals. (*) P < 0.05.

