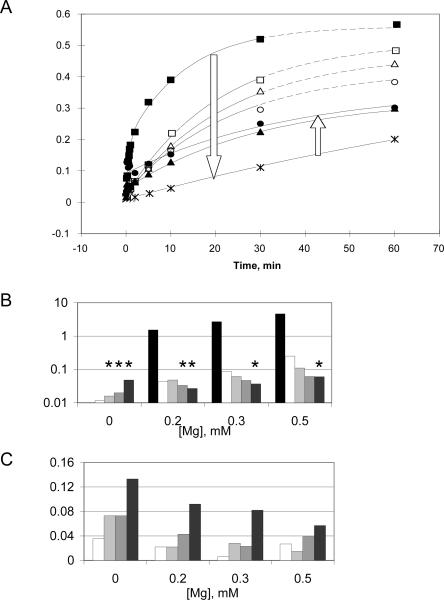
FIGURE 4.
(A) Plot of competition assays at 37°C, pH 7.4 in the presence of 0.2 mM Mg2+ only (filled squares, 1.54 min−1) or in the presence of 0.2 mM Mg2+ supplemented with CoHex at concentrations of 0.1 mM (open triangles, 0.043 min−1), 0.5 mM (open squares, 0.048 min−1), 0.75 mM (open circles, 0.042 min−1), 1 mM (asterisks, 0.0071 min−1), 2 mM (filled triangles, 0.033 min−1), or 10 mM (filled circles, 0.031 min−1). k obs was calculated by fitting each time course to a single-exponential equation, except the one in Mg2+ alone, for which a double-exponential equation was used; burst phase noticed in 5 mM (not shown) and 10 mM [Co (NH3)6]3+. Dashed lines are used for the best-fit curves when CoHex concentration was below 1 mM; solid lines are used for 1 mM and above. Arrows show progression of curves as CoHex concentration increased. (B,C) Bar graphs of competition assays under four different Mg2+ concentrations (indicated below the graphs) supplemented with CoHex at concentrations of 0 mM (black); 0.1 mM (white); 0.5 mM (light gray); 2 mM (gray); 10 mM (dark gray). (B) k obs values calculated under different metal conditions. Asterisks (*) indicate conditions under which detectable burst was observed and single-exponential curve fitting was used to estimate the rate during the slow phase. (C) The burst magnitude (F 0) was calculated from curve fitting the kinetic data with a single-exponential equation. A background value of approximately 0.04 was observed, arising from the background radioactivity of the gels and representing the noise in the burst fraction obtained from the curve fit.

