
Figure 1.
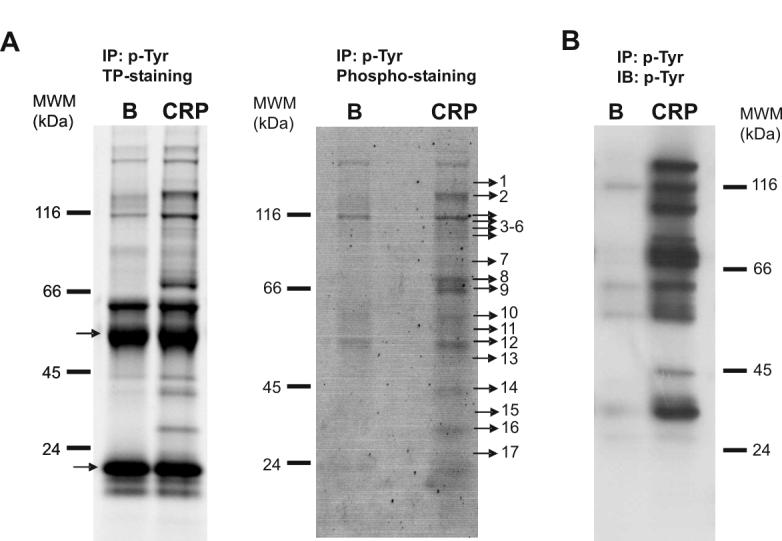
Tyrosine phosphoproteome analysis of CRP-stimulated platelets. (A) left panel, total protein staining of a 4-12% NuPAGE Bis-tris gel showing all the proteins immunoprecipitated with the 4G10 antibody in Basal and CRP-stimulated platelets (bands corresponding to IgG chains are indicated by arrows); right panel, phosphoprotein staining of an equivalent 4-12% NuPAGE Bis-tris gel showing tyrosine phosphorylated proteins obtained after 4G10 immunoprecipitation of Basal and CRP-stimulated platelets. Indicated bands were excised from the gel and analyzed. Proteins identified are reported in Table 1. (B) Similar to (A) but the gel was blotted instead of stained, followed by an anti-4G10 western blot to visualize the tyrosine-phosphorylated proteins. B, basal platelets; CRP, platelets stimulated with CRP (10 μg/mL, 90 sec); IP, immunoprecipitation; IB, immuno blot; TP, total protein. Images represent at least three independent experiments.